Analysing frequency tables

When you're looking at a big set of data – like test scores or survey results – it's not always easy to make sense of all the numbers. That’s where mean, median, mode, and range come in. These are ways to summarise the data and spot patterns. And when the data is organised in a frequency table, it helps you quickly see what happens most often, what's typical, and how spread out the results are – skills that come in handy in everything from science experiments to sports stats! Jump to the questions
Practise now
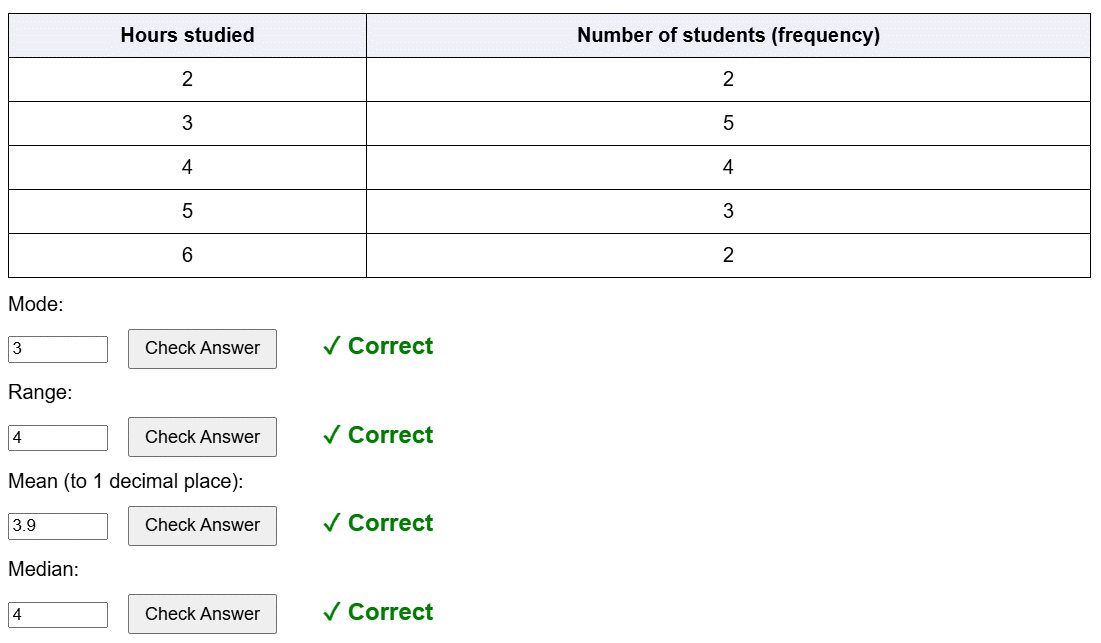
Calculate the mode, range, mean, and median.
Score: 0 / 12
