
Exponential Graphs
Practise plotting and interpreting exponential graphs at GCSE Higher level. You will work with growth and decay, exact powers, asymptotes and equations of the form y = abx.
The questions build from key graph features and tables of values to finding an exponential model from two points. Jump to the questions
Practise now
Worksheet preview and key skills
Worksheet preview
This eight-question GCSE Higher worksheet develops a secure understanding of exponential growth and decay graphs.
You will evaluate powers, plot points directly on Cartesian grids and determine exact exponential models.
What you’ll practise
- Using intercepts, asymptotes and tables of values.
- Plotting smooth growth and decay curves.
- Solving exact powers and bracketing non-exact solutions.
- Finding a and b in y = abx.
Use the interactive worksheet below, or read the Topic guide for the method and worked example.
Exponential Graphs
Answer all eight questions. Plot graph points directly on each grid.
Topic guide
What is an exponential function?
In an exponential function, the variable is in the exponent. The basic form is y = kx, where k is the base. A more general form is y = abx.
- If k or b is greater than 1, the graph shows exponential growth.
- If 0 < k < 1, or 0 < b < 1, the graph shows exponential decay.
- y = kx crosses the y-axis at (0, 1), because k0 = 1.
- y = abx crosses the y-axis at (0, a).
- For the positive-base, unshifted functions here, y = 0 is a horizontal asymptote. The curve approaches the x-axis but does not reach it.
Evaluate and plot
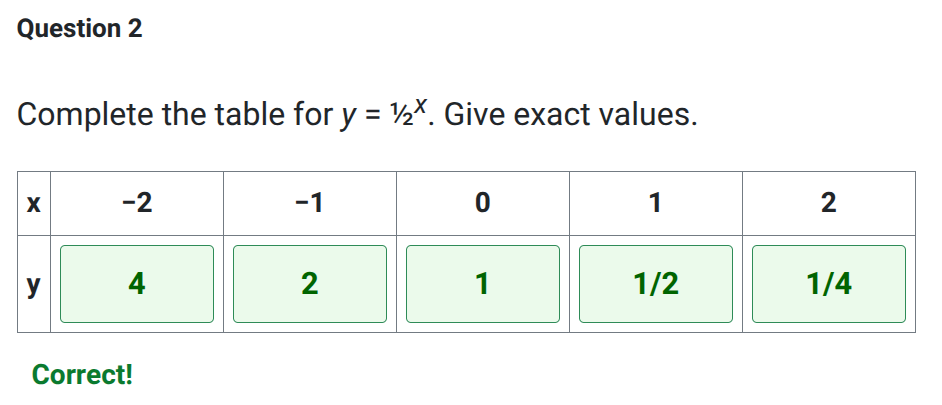
Use the usual power rules. For example, for y = 3x, the values at x = −2, −1, 0, 1 and 2 are 1/9, 1/3, 1, 3 and 9. A negative exponent gives a reciprocal: 3−2 = 1/32 = 1/9.
Complete a table, plot each coordinate carefully, then draw one smooth curve through all the points. Do not join neighbouring points with straight line segments.
Read and solve
Familiar powers give exact solutions. If 4x = 64, then x = 3. If a target is not an exact power, compare neighbouring powers. Since 32 = 9 and 33 = 27, the solution of 3x = 20 lies between 2 and 3.
Find an exponential model
If y = abx passes through (0, 4) and (2, 36), the first point gives a = 4. Then 36 = 4b2, so b2 = 9 and the positive base is b = 3.
When neither point has x = 0, substitute both points and divide the equations. For points (1, 10) and (3, 90): 10 = ab and 90 = ab3. Dividing gives 9 = b2, so b = 3 and then a = 10/3.
Common mistakes
- Do not treat kx as kx, or put the point (0, 0) on the curve.
- Do not let the curve touch or cross its horizontal asymptote.
- Growth and decay use multiplicative ratios, not additive differences.
- For negative x, a larger positive base produces a smaller value.
- In y = abx, a is the y-intercept and b is the base.
- When both x-values are non-zero, divide the two equations to eliminate a.
Logarithms can solve more general exponential equations later, but they are not needed in this worksheet.