
Frequency trees
Frequency trees help you sort and count information in a clear way. They’re great for working out how many people or things fit into different groups, like how many students prefer different snacks or how many passed a test. It’s like building a picture of the data, step by step! Jump to the questions
Practise now
Worksheet preview and key skills
Worksheet preview
Practise frequency trees with this self-marking maths worksheet.
The interactive worksheet below generates questions, gives instant feedback, and lets students record their score.
What you’ll practise
- Completing branches in a frequency tree.
- Using totals to find missing frequencies.
- Following categories through the tree.
- Interpreting two-stage frequency information.
Use the interactive worksheet below, or read the Topic guide for the method and worked example.
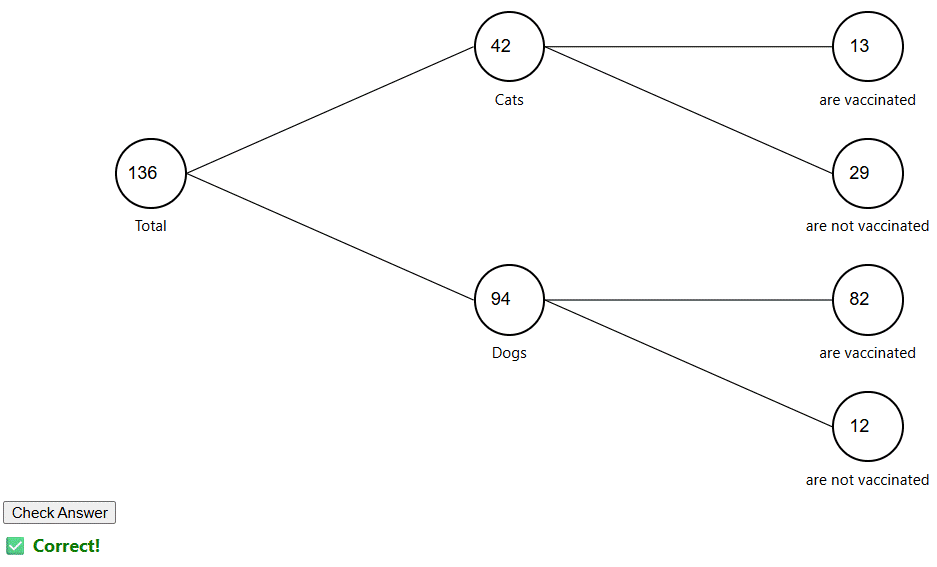
Complete the frequency trees below.
Topic guide
What this worksheet practises
This worksheet provides practice on completing and interpreting frequency trees. Frequency trees are visual diagrams used to sort and break down a total population into smaller and smaller sub-categories. They are highly effective for solving multi-step logic problems without getting lost.
Key method
The fundamental rule of a frequency tree is that the numbers in the branches must add up to the number in the circle they originated from.
- Identify the grand total (usually at the far left).
- When a circle splits into two or more branches, the numbers in the new circles must sum to the number in the previous circle.
- Use subtraction to find missing numbers. If a total of 50 splits into "Boys" and "Girls", and you know there are 20 Boys, the Girls must be 50 − 20 = 30.
- Fill in the tree systematically, working from left to right (using division/percentages) or right to left (using addition) depending on what information the question gives you.
Worked example
80 students take an exam. 45 are boys. 30 of the boys pass. 15 of the girls fail. Complete a frequency tree to find out how many girls pass.
Step 1: Start on the left. The total is 80. It splits into Boys and Girls.
Boys = 45. We find the Girls by subtraction: 80 − 45 = 35.
Step 2: Look at the Boys branch. It splits into Pass and Fail.
We know 30 Boys pass. The Boys total was 45. So, 45 − 30 = 15 Boys fail.
Step 3: Look at the Girls branch. It splits into Pass and Fail.
We know 15 Girls fail. The Girls total was 35. So, 35 − 15 = 20 Girls pass.
The final answer is 20.
Common mistakes to avoid
A frequent mistake is putting probabilities or fractions inside the circles. Frequency trees are for whole numbers of items (frequencies) only. The circles contain the actual headcounts, not the chance of an event happening.
How to check your answer
The numbers in the final column of circles on the far right-hand side must all add up to the grand total in the first circle on the far left. In our example, the final circles are Boys Pass (30) + Boys Fail (15) + Girls Pass (20) + Girls Fail (15) = 80. The arithmetic is correct.