Interpreting pie charts
Pie charts are a useful way to show how a whole group has been split into different parts. You might see them in surveys, news articles, sports reports, school data, business information or anywhere people want to compare categories quickly.
The key idea is that the full circle represents the whole amount. Since a full turn is 360°, each sector angle tells you what fraction of the total belongs to that category. For example, a sector of 90° is one quarter of the pie chart, so it represents one quarter of the people or items. Jump to the questions
Practise now
Worksheet preview and key skills
Worksheet preview
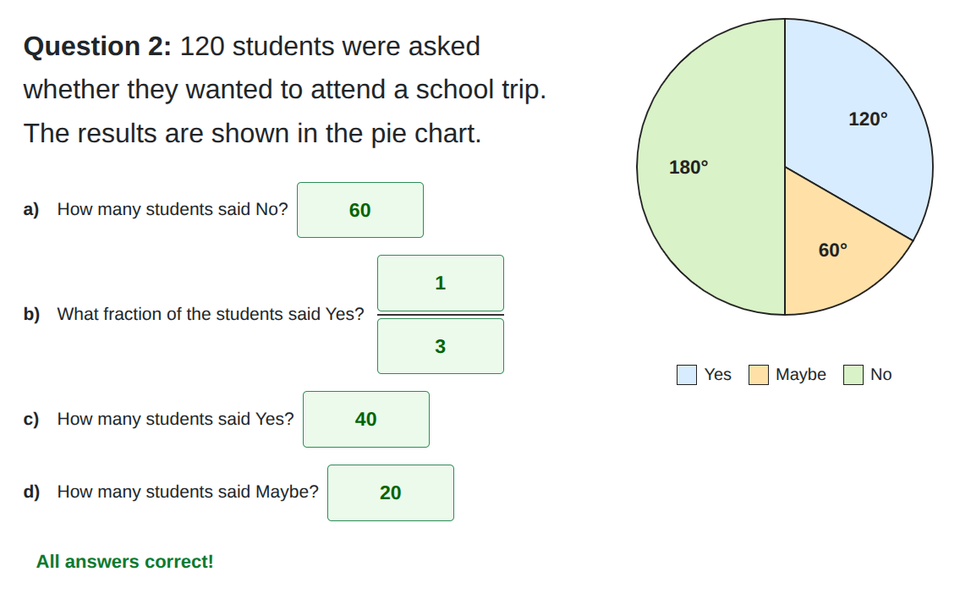
Practise interpreting pie charts with this self-marking maths worksheet.
The interactive worksheet below generates questions, gives instant feedback, and lets students record their score.
What you’ll practise
- Reading sectors from a pie chart.
- Using angles, fractions or percentages where relevant.
- Comparing categories.
- Calculating values from the total where needed.
Use the interactive worksheet below, or read the Topic guide for the method and worked example.
Interpreting Pie Charts
Topic guide
What does a pie chart show?
A pie chart is a circular graph used to display data as parts of a whole. The full circle represents everyone or everything in the group (the total frequency).
Because a full circle contains 360°, every 1° of the pie chart represents an exact fraction of the total group.
Using angles to find fractions
To find out what fraction of the total group a sector represents, write its angle out of 360 and simplify:
- Fraction of total = Sector angle / 360
Finding frequencies from a pie chart
If you know the total number of people or items (the total frequency), you can calculate the exact number in any sector. First find the simplified fraction, then multiply it by the total.
- Frequency = Fraction × Total
Finding a missing angle
The angles around the centre of a pie chart must always add up to exactly 360°. To find a missing angle, simply add up all the given angles and subtract their total from 360°.
Worked example
A pie chart shows 120 students’ favourite sports. The angle for the football sector is 90°.
Question: What fraction chose football, and how many students is this?
- Fraction: 90 / 360, which simplifies to 1/4.
- Number of students: Find 1/4 of 120.
120 ÷ 4 = 30 students.
Question: In a different pie chart, the known angles are 60°, 72°, 90° and 108°. Find the missing angle x.
- Add the known angles: 60 + 72 + 90 + 108 = 330°
- Subtract from 360°: 360° - 330° = 30°
- The missing angle x is 30°.
Common mistakes to avoid
- Confusing angles and frequencies: Remember that an angle of 90° does not mean there are 90 people. Always calculate the frequency using the total.
- Forgetting to simplify fractions: An answer like 72/360 is correct, but writing it in its simplest form (1/5) makes working out the frequency much easier.
- Adding up incorrectly: When finding a missing angle, double-check your addition before subtracting from 360°.
Things to remember
- The whole pie chart always represents 360°.
- Fraction = Angle / 360.
- Frequency = Fraction × Total frequency.
- Missing angle = 360° - (sum of all other angles).