Interquartile range
The **interquartile range (IQR)** measures the spread of the middle 50% of a data set, giving us a sense of how varied the central values are while ignoring extreme outliers. It’s especially useful in real-world scenarios like analyzing exam scores, house prices, or salaries, where you want to focus on the typical range rather than being misled by unusually high or low values. Jump to the questions
Practise now
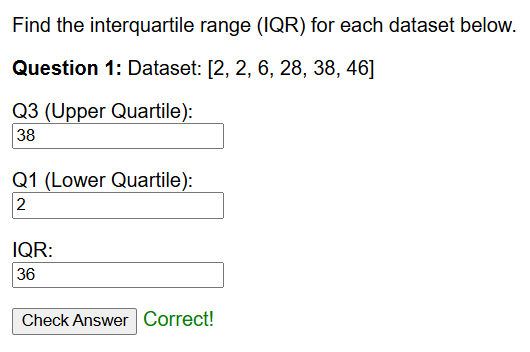
Find the interquartile range (IQR) for each dataset below.
Topic guide
What this worksheet practises
This worksheet provides practice on calculating the Interquartile Range (IQR). While the standard range measures the total spread from highest to lowest, the IQR measures the spread of the middle 50% of the data. This makes it highly useful because it ignores extreme outliers.
Key method
The IQR is the difference between the Upper Quartile (the 75% mark) and the Lower Quartile (the 25% mark).
- First, write all the numbers in size order from smallest to largest.
- Find the median (the middle number). This splits the data into a lower half and an upper half.
- Find the middle number of the lower half. This is the Lower Quartile (LQ).
- Find the middle number of the upper half. This is the Upper Quartile (UQ).
- Calculate the IQR by subtracting the LQ from the UQ: IQR = UQ − LQ.
Worked example
Find the interquartile range of: 12, 5, 8, 20, 15, 3, 9.
Step 1: Put the numbers in order.
3, 5, 8, 9, 12, 15, 20.
Step 2: Find the median. There are 7 numbers, so the median is the 4th number.
The median is 9.
Step 3: Look at the lower half of the data (3, 5, 8). The middle number here is the LQ.
Lower Quartile (LQ) = 5.
Step 4: Look at the upper half of the data (12, 15, 20). The middle number here is the UQ.
Upper Quartile (UQ) = 15.
Step 5: Calculate the IQR (UQ − LQ).
15 − 5 = 10. The IQR is 10.
Common mistakes to avoid
The most common mistake is forgetting to put the numbers in size order before finding the quartiles. Another common issue is including the median in the upper and lower halves when splitting the data. Once you find the median, draw a circle around it; it belongs to neither the lower half nor the upper half.
Things to remember
A small Interquartile Range means the data is very consistent and tightly packed around the median. A large Interquartile Range means the data is highly varied and spread out.