Solving quadratic equations graphically
Quadratic graphs are useful because they let us see the solutions to an equation. When a quadratic equation is equal to 0, the solutions are the points where the curve crosses the x-axis. These are called the roots or x-intercepts.
On this worksheet, use the graphs to estimate the two x-values that solve each equation. Your answers do not need to be perfect, but they should be sensible estimates from the graph. Jump to the questions
Practise now
Worksheet preview and key skills
Worksheet preview
Practise solving quadratic equations using graphs with this self-marking maths worksheet.
The interactive worksheet below generates questions, gives instant feedback, and lets students record their score.
What you’ll practise
- Reading a quadratic graph.
- Finding where the graph crosses the x-axis.
- Using x-intercepts as solutions.
- Estimating roots from the graph where needed.
Use the interactive worksheet below, or read the Topic guide for the method and worked example.
Use each graph to estimate the x-values where the curve meets the required y-value. If the equation equals 0, look for where the curve crosses the x-axis. If the equation equals another number, look across from that y-value and read the matching x-values.
Estimates are acceptable and answers may be entered in either order.
Topic guide
Solving a quadratic equation using a graph means finding the x-values on a drawn curve that match a specific condition given by the equation.
When you have a plotted quadratic graph, you can use it to solve related equations without doing any complex algebra:
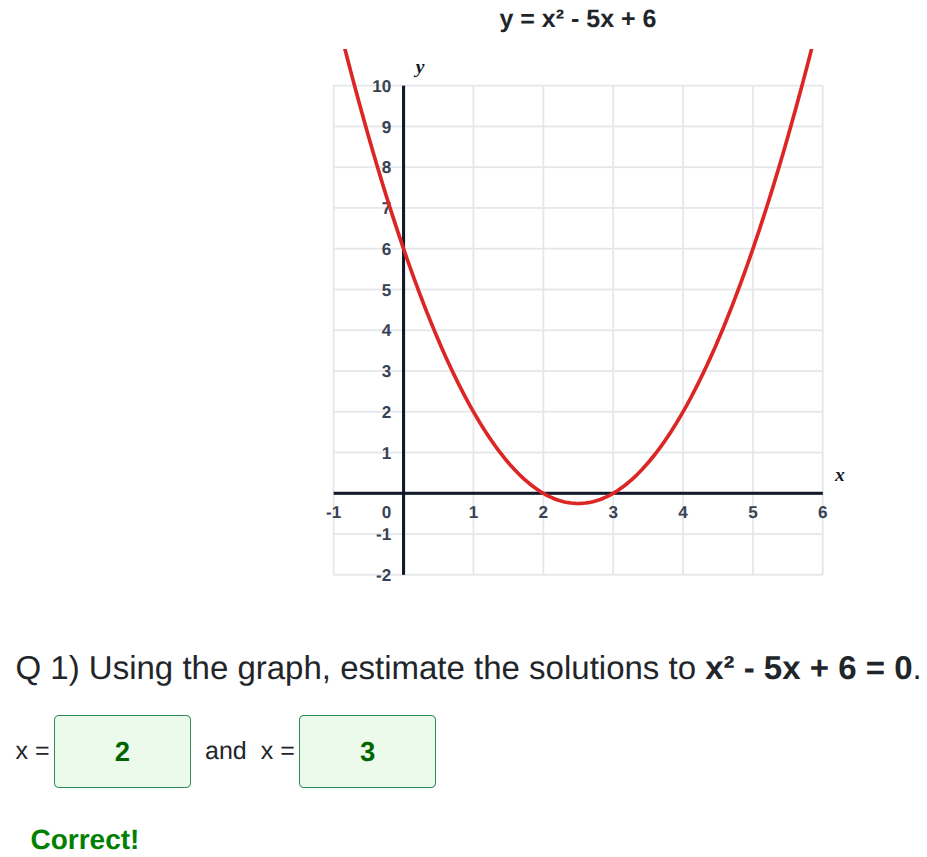
- If the equation equals zero (for example, x² - 5x + 6 = 0), you are looking for the points where the curve crosses the x-axis.
- If the equation equals a different number (for example, x² - 2x - 1 = 1), you need to find where the curve has a y-value of 1. You look across from 1 on the y-axis to the curve, and then read the matching x-values.
Key method
- Look at the number on the right-hand side of your equation.
- Find that number on the y-axis of your graph.
- Draw a horizontal line across from that y-value until you hit the curve. (If the equation equals zero, this line is just the x-axis).
- From the point, or points, where you hit the curve, read directly down or up to the x-axis to find your solutions.
Worked example
Suppose you have the graph of y = x² + 2x - 3 and you are asked to solve the equation x² + 2x - 3 = 5.
- First, locate 5 on the y-axis.
- Draw a horizontal line straight across from y = 5.
- Find where this line crosses the U-shaped curve. It should cross in two places.
- Read the x-coordinates for both of those crossing points. You might find they are roughly x = 2.4 and x = -4.4. These are your two estimates.
Common mistakes and useful tips
- Reading the wrong axis: Always make sure you give the x-values for your final answers, not the y-values.
- Forgetting the second solution: A U-shaped curve usually crosses a horizontal line twice, meaning there are two valid answers. Make sure you find both of them.
- Always looking at the x-axis: It's tempting to always look for the x-intercepts, but you only do this when the equation is equal to 0.
- Being too precise: Remember that reading from a graph only gives an estimate. Do not try to guess multiple decimal places; one decimal place is usually enough depending on the grid scale.
- Answer order: When you have two solutions, it does not matter which order you write them in.