Composite bar charts
Composite bar charts show how a total is split into different groups, such as boys and girls in each year group. Use this worksheet to practise reading values, finding totals, and comparing parts of each bar. Jump to the questions
Practise now
Composite Bar Charts
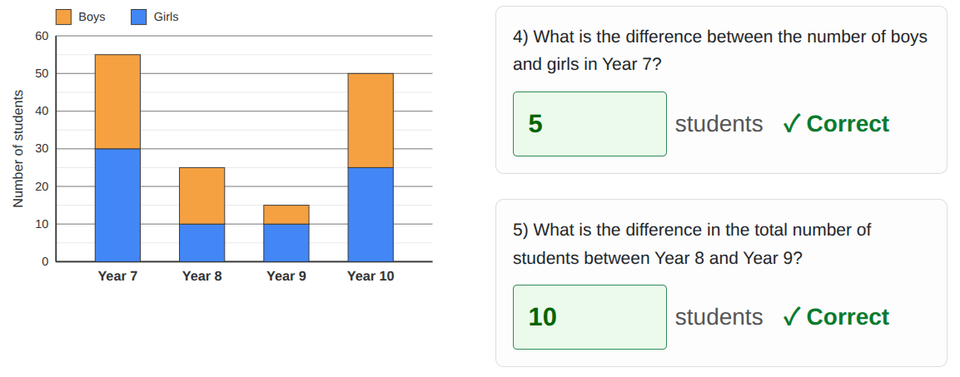
Read the composite bar charts and answer the questions below.
Topic guide
What this worksheet practises
This worksheet helps you practise reading and interpreting composite bar charts. A composite bar chart (sometimes called a stacked bar chart) is a way of showing multiple pieces of data in a single bar.
Key method
In a composite bar chart, each full bar represents a total amount. This total is split into coloured sections, where each section shows a part of that total.
- Reading a section starting at zero: The bottom section of the bar starts at zero, so you can read its value directly from the axis.
- Reading a stacked section: To find the value of a section that sits on top of another, read the value at the top of the section and subtract the value at the bottom of the section. Or, simply count the grid squares it covers.
- Finding the total for a bar: Read the value at the very top of the highest section. This gives you the total for that entire bar.
- Comparing parts: You can compare two sections within the same bar, or compare the totals of two different full bars, by calculating the difference between their values.
Worked example
A composite bar chart shows the number of boys and girls in Year 8. The blue section (girls) starts at 0 and goes up to 15. The orange section (boys) sits on top of the blue section and goes up to 35.
Question 1: How many girls are in Year 8?
Because the girls section starts at 0, we can read the top of the blue section directly. There are 15 girls.
Question 2: How many students are in Year 8 altogether?
Read the very top of the whole bar. The top of the orange section reaches 35. There are 35 students in total.
Question 3: How many boys are in Year 8?
The boys section starts at 15 and ends at 35. To find the number of boys, subtract the bottom value from the top value:
35 − 15 = 20 boys.
Question 4: What is the difference between the number of boys and girls in Year 8?
We know there are 20 boys and 15 girls. Subtract the smaller number from the larger number:
20 − 15 = 5 students.
Useful tips
Always check the scale on the vertical axis before you start. Each line might represent 1 student, but they could also represent 2, 5, or 10 students. Look carefully at the legend to make sure you know what each colour represents.
Common mistakes to avoid
A frequent error is reading the top of a stacked section and thinking it represents just that single category. For example, if the top of the boys section reaches 35, it means there are 35 students altogether in that bar, not 35 boys. You must subtract the section below it to find the number of boys.
How to check your answer
When you have found the value of each individual section, add them together. They should equal the number at the very top of the full bar. For instance, if you calculated 15 girls and 20 boys, 15 + 20 = 35, which matches the total height of the bar.