Currency exchange conversion graphs
Whether you're shopping online from another country or planning a holiday abroad, understanding how currency conversion works is essential. Currency conversion graphs help us quickly see how much one currency is worth in another, making it easier to spot the best time to exchange your money. Jump to the questions
Practise now
Worksheet preview and key skills
Worksheet preview
Practise currency exchange conversion graphs with this self-marking maths worksheet.
The interactive worksheet below generates questions, gives instant feedback, and lets students record their score.
What you’ll practise
- Reading values from a conversion graph.
- Matching one currency to another.
- Using the scale on the axes.
- Estimating values from the graph where needed.
Use the interactive worksheet below, or read the Topic guide for the method and worked example.
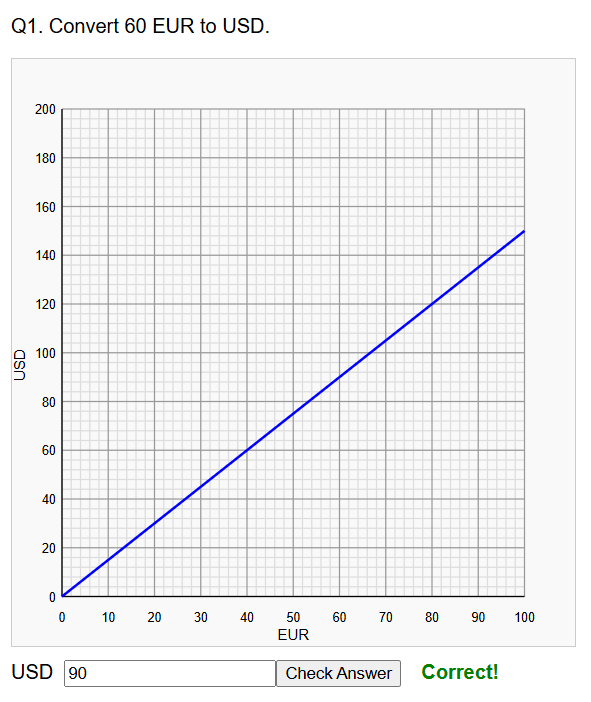
Answer each of the questions below by reading from the conversion graph provided.
Topic guide
What this worksheet practises
This worksheet focuses on using conversion graphs to change one currency into another. A conversion graph is a straight line graph starting at the origin (0,0) that visually represents an exchange rate, allowing you to read conversions directly without calculating them.
Key method
To use a conversion graph, you trace a line from the known value on one axis to the drawn line, and then read across to the other axis.
- Find your starting amount on the correct axis (e.g., the Pounds axis).
- Draw a straight vertical line up (or horizontal line across) from that number until it hits the conversion graph line.
- From that exact point on the line, draw a straight line directly across (or down) to the opposite axis.
- Read the value on that second axis. That is your converted amount.
Worked example
Use a Pounds-to-Dollars graph to convert £20 into Dollars. Then, find the exchange rate for £1.
Step 1: Find 20 on the Pounds axis.
Step 2: Trace a line up to the drawn graph line.
Step 3: Trace a line across to the Dollars axis and read the value. Let's say it reads 26.
The conversion is $26.
Step 4: Find the exchange rate for £1. The value for £1 might be too small to read accurately on the graph. Instead, take your previous reading (£20 = $26) and divide both sides by 20.
26 ÷ 20 = 1.30.
The exchange rate is £1 = $1.30.
Common mistakes to avoid
A frequent error is misreading the scale of the axes. Always check what one small square represents before reading a value. For example, if 10 big squares represent 50 units, then one small square represents 5 units, not 1.
How to check your answer
Pick a second point on the graph that is easy to read (like a corner coordinate) and use it to check your conversion factor. If the graph is a straight line through the origin, the ratio between the x and y values should be identical everywhere on the line.