
Drawing straight line graphs
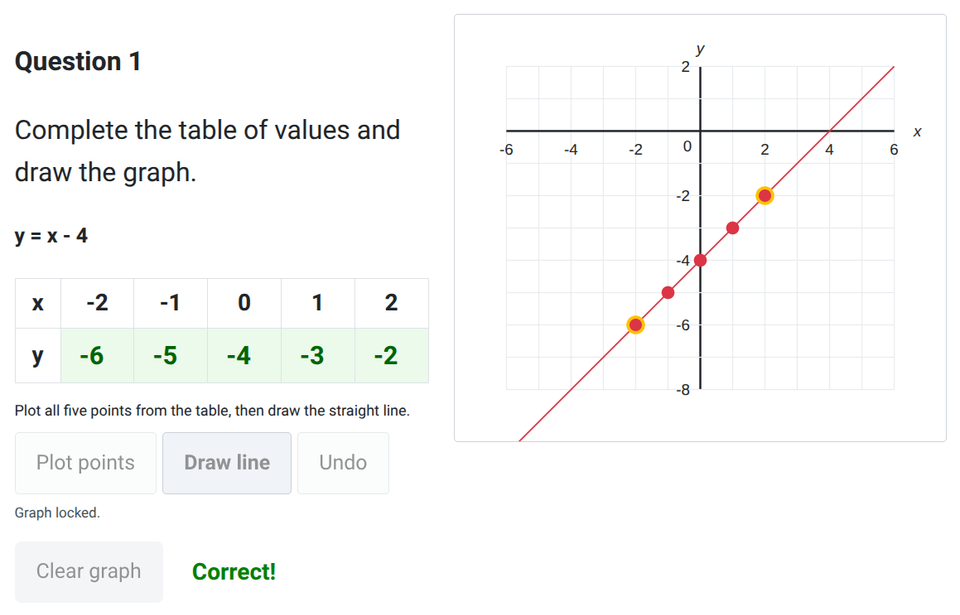
This worksheet provides practice on completing a table of values, plotting the resulting coordinates, and joining them with a straight line. Straight line graphs are used to show linear relationships, and mastering them is a key algebra skill. Jump to the questions
Practise now
Worksheet preview and key skills
Worksheet preview
In this worksheet, you will complete tables of values for various linear equations, plot the coordinates on an interactive graph, and draw the straight line connecting them.
The questions progress from simple equations to those involving negative gradients and fractional coefficients.
What you’ll practise
- Substituting x-values into a linear equation
- Completing a table of values
- Plotting ordered coordinate pairs accurately
- Drawing and using a straight line graph
Use the interactive worksheet below, or read the Topic guide for the method and worked example.
Topic guide
What a straight line graph shows
A straight line graph is a visual way of showing a linear relationship between two variables, usually x and y. Every point on the line has an x-coordinate and a y-coordinate that together satisfy the given equation.
The three-step method
- Substitute each x-value into the equation to calculate the matching y-value.
- Write the resulting y-values in a table of values to form (x, y) coordinate pairs.
- Plot each point accurately on the graph and use a ruler-style straight line through the points.
Worked example
Draw the graph of y = 2x - 1 for x-values from -1 to 2.
First, substitute the x-values:
- When x = -1, y = 2(-1) - 1 = -3
- When x = 0, y = 2(0) - 1 = -1
- When x = 1, y = 2(1) - 1 = 1
- When x = 2, y = 2(2) - 1 = 3
This gives the corresponding y-values: -3, -1, 1, 3. The coordinate pairs are (-1, -3), (0, -1), (1, 1) and (2, 3).
Plot each point (x, y) on the grid, and then draw a single straight line passing through all of them. The line should be extended to the edges of the grid.
Using the graph
Once your line is drawn, you can use it to find other values. For example, to find the y-value when x = 0.5, find 0.5 on the x-axis, move vertically to your line, and read horizontally to the y-axis to find the answer (y = 0).
Common mistakes
- Mishandling a negative x-value (e.g., adding instead of subtracting).
- Plotting coordinates in the wrong order (always go along the x-axis first, then up or down the y-axis).
- Using an inconsistent graph scale when drawing your own axes.
- Drawing a curve or separate short segments between points instead of one continuous straight line.
- Drawing a line that misses one or more plotted points — if this happens, check your calculations!
- Reading from the wrong axis when using the graph to find a value.
Quick recap
Always create a table of values first. Plot the points carefully, check they form a straight line, and draw a single continuous line through them all.