Finding the mode
The mode is the number or item that appears most often in a set of data. Understanding the mode can help identify trends, like finding the most popular shoe size in a store or the favorite sport in a school survey! Jump to the questions
Practise now
Worksheet preview and key skills
Worksheet preview
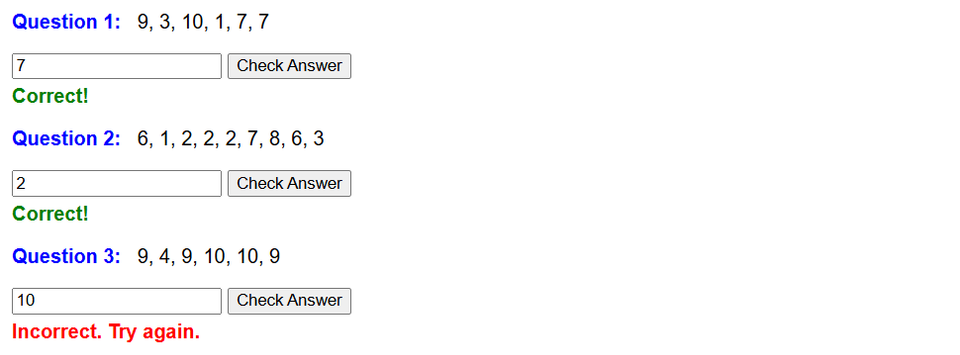
Practise finding the mode with this self-marking maths worksheet.
The interactive worksheet below generates questions, gives instant feedback, and lets students record their score.
What you’ll practise
- Spotting the value or category that appears most often.
- Using frequency where relevant.
- Recognising when there is no mode or more than one mode.
- Interpreting the mode as an average.
Use the interactive worksheet below, or read the Topic guide for the method and worked example.
Find the mode of each list of values below. If there is no mode, enter "N". If there are two modes (bimodal), enter "B".
Topic guide
What this worksheet practises
This worksheet provides practice on finding the mode from a set of data. The mode is one of the easiest averages to calculate, because it requires almost no actual mathematics. It simply asks you to identify the most common item. It is the only average that can be used for non-numerical data (like colours or car brands).
Key method
To find the mode, you simply count how many times each item appears.
- Look through the entire list of data.
- Count the frequency of each distinct number or item. (A tally chart can be very helpful here).
- Identify the item that appears most often (has the highest frequency).
- That item is the mode.
Worked example
Find the mode of the following shoe sizes: 5, 8, 5, 6, 9, 8, 5, 11.
Step 1: Count the frequency of each size.
Size 5 appears 3 times.
Size 6 appears 1 time.
Size 8 appears 2 times.
Size 9 appears 1 time.
Size 11 appears 1 time.
Step 2: Find the highest frequency.
The highest frequency is 3.
Step 3: State the mode.
The number that appears 3 times is 5. Therefore, the mode is 5.
Common mistakes to avoid
The single most common mistake is writing down the frequency instead of the actual data value. In the example above, a student might write "3" because size 5 appeared 3 times. This is incorrect. The shoe size is 5; 3 is just how many people wore it. The mode is 5.
Things to remember
A set of data can have more than one mode. If shoe size 5 appeared three times, and size 8 also appeared three times, the data is "bimodal" (two modes). You would simply write both 5 and 8. Sometimes, if every single number appears only once, there is no mode at all.