Calculating the range
The range is a measure of how spread out a set of numbers is, found by subtracting the smallest number from the largest. It’s used in real life to compare variations, like tracking the temperature highs and lows in a week or analyzing the fastest and slowest times in a race. Jump to the questions
Practise now
Worksheet preview and key skills
Worksheet preview
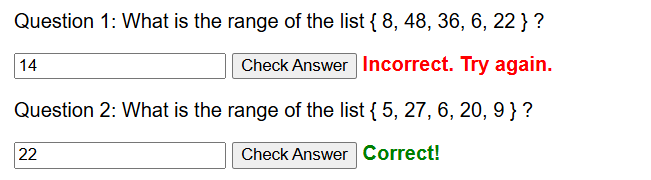
Practise calculating the range with this self-marking maths worksheet.
The interactive worksheet below generates questions, gives instant feedback, and lets students record their score.
What you’ll practise
- Identifying the highest value.
- Identifying the lowest value.
- Subtracting the lowest from the highest.
- Using the range to describe spread.
Use the interactive worksheet below, or read the Topic guide for the method and worked example.
For each list of values, calculate the range.
Topic guide
What this worksheet practises
This worksheet provides practice on calculating the range of a set of data. The range is a measure of spread or variation. Unlike averages (which find a central value), the range tells you how spread out the data is. A small range means the data is consistent and tightly grouped; a large range means the data is widely varied.
Key method
Finding the range is a simple subtraction calculation involving only the extremes of the dataset.
- First, scan the list of data to find the highest (maximum) value.
- Second, scan the list again to find the lowest (minimum) value.
- Finally, subtract the lowest value from the highest value.
Worked example
Find the range of these temperatures: 12°C, 5°C, 18°C, 9°C, 2°C, 15°C.
Step 1: Find the highest value.
The highest temperature is 18°C.
Step 2: Find the lowest value.
The lowest temperature is 2°C.
Step 3: Subtract the lowest from the highest.
18 − 2 = 16
The range is 16°C.
Common mistakes to avoid
The most common error is picking the first and last numbers in the list without checking if they are actually the highest and lowest values. Data is rarely given to you in perfect numerical order. Always take the time to scan the whole list carefully. Be particularly careful when the data includes negative numbers; remember that −10 is lower than −2.
Things to remember
The range is a single number, not a descriptive gap. If the lowest value is 2 and the highest is 18, the range is "16". You should never write the answer as "2 to 18" or "2 - 18".