
Inequalities on graphs
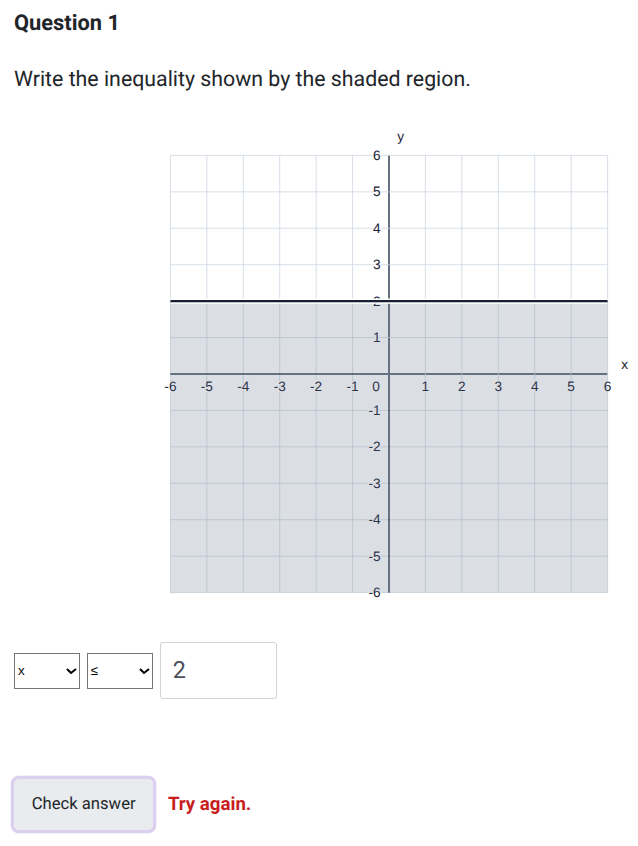
Practise GCSE inequalities on graphs: read shaded regions, draw linear boundaries and find points that satisfy several conditions at once. The eight questions move from vertical and horizontal lines to sloping boundaries, strips, overlapping regions and integer-coordinate solutions.
Replace the inequality sign with = to draw the boundary. Use a solid line for ≤ or ≥ and a dashed line for < or >. Test an easy point, such as (0, 0) when it is not on the line, to choose the correct side. For simultaneous inequalities, keep only the overlap that satisfies every condition. Jump to the questions
Practise now
Worksheet preview and key skills
Worksheet preview
Eight questions, one mark each. Read a simple inequality and a sloping inequality from shaded graphs, then draw boundaries and shade a region satisfying one inequality, a strip and a region satisfying three inequalities.
Finish by choosing three inequality signs for a shaded region and drawing three working boundaries before marking every integer-coordinate solution to a system. For drawing answers, choose Solid or Dashed first, tap two different points where grid lines cross for each boundary, then shade the required region. Read-off answers use sign controls; the sloping answer also needs a linear expression.
What you’ll practise
- Recognising vertical, horizontal and sloping boundaries.
- Choosing line styles and testing which side satisfies an inequality.
- Finding an overlap and checking integer points against every condition.
Use the interactive worksheet below, or read the Topic guide for the method and worked example.
Inequalities on graphs
Complete each graph or answer, then select Check answer. For drawing questions, choose each boundary’s style and place two points. Then shade the region or mark the integer-coordinate solutions as requested.
Topic guide
A linear inequality describes a region of the coordinate plane. Its boundary is a straight line; the inequality tells you which side to include and whether the line itself belongs to the solution.
Drawing and shading
- Replace the inequality symbol with =. Plot two accurate points on this boundary and join them with a straight line.
- Use a solid line for ≤ or ≥: points on the boundary count. Use a dashed line for < or >: points on that boundary do not count.
- Choose a test point away from the boundary. Substitute its coordinates into the original inequality. If the statement is true, shade the side containing that point; otherwise shade the other side.
The origin (0, 0) is often convenient, but use another point if the boundary passes through it. The line x = a is vertical because every point has the same x-coordinate; y = a is horizontal.
Worked example: a sloping inequality
To represent y > −2x + 3, draw the boundary y = −2x + 3 through (0, 3) and (2, −1). Make it dashed because the inequality is strict. At (0, 0), the inequality becomes 0 > 3, which is false. Shade the side away from the origin, above the line. The point (1, 2) satisfies 2 > 1, but (1, 1) lies on the dashed boundary and is excluded.
Standard form and overlapping regions
For a boundary such as 2x + y = 5, find two points by substitution: x = 1 gives y = 3, and x = 3 gives y = −1. There is no need to guess the slope. Apply the original inequality to decide the shading.
For two or three simultaneous inequalities, every condition must hold. Draw each boundary with its own line style and keep only their common shaded overlap. A strip such as −1 < y ≤ 4 lies between two horizontal lines, dashed at y = −1 and solid at y = 4.
Worked example: integer solutions
Consider x ≥ 1, y ≥ 0 and x + y < 4. For x = 1, the allowed integer y-values are 0, 1 and 2. For x = 2, they are 0 and 1; for x = 3, only 0 works. The complete set is (1, 0), (1, 1), (1, 2), (2, 0), (2, 1) and (3, 0). Points such as (2, 2) are excluded because their sum is 4, on the strict boundary. Check each lattice point against all three conditions.
Reading a shaded graph
First find the boundary equation using accurate points. Choose < or > by testing a point inside the shading, then include equality if the boundary is solid. For y = mx + c, points above the line have y > mx + c and points below it have y < mx + c. When several lines enclose a region, repeat this check for each line separately.
Common mistakes
- Shading the wrong side without checking a test point.
- Using a solid line for a strict inequality, or a dashed line when equality is allowed.
- Keeping a point that satisfies only some of the inequalities.
- Including an integer point on a dashed boundary.
- Mixing up vertical x = a and horizontal y = a boundaries.
- Guessing or averaging slopes instead of plotting two accurate boundary points.