
Distance-time graphs
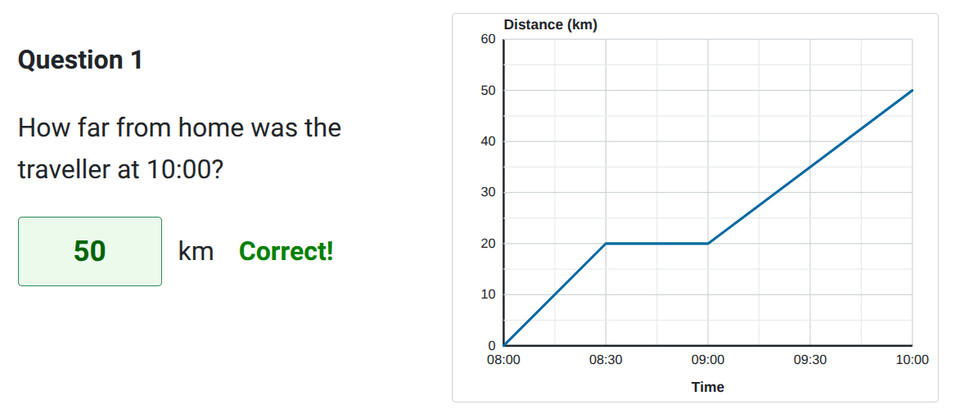
Distance-time graphs show how far a traveller is from a starting point over time. The horizontal axis represents time, and the vertical axis represents distance. They are a powerful way to describe a complete journey at a glance.
In this topic, you will learn to read distance-time graphs to find when someone is moving or stationary. You will use the steepness (gradient) of the line to compare and calculate speeds, work out total distances travelled, and calculate the average speed for a whole journey. Jump to the questions
Practise now
Worksheet preview and key skills
Worksheet preview
This worksheet provides interactive practice with reading and constructing distance-time graphs.
You will interpret existing graphs to extract information about journeys and use a blank grid to plot chronological turning points from a written scenario.
What you’ll practise
- reading distances and stationary periods;
- finding total distance travelled;
- calculating speed from gradient;
- calculating whole-journey average speed;
- constructing a journey graph.
Use the interactive worksheet below, or read the Topic guide for the method and worked example.
Distance-time graphs
Read and construct distance-time graphs to find speeds, distances and stationary periods.
Topic guide
What the axes show
On a distance-time graph, the horizontal x-axis always represents time. This could be a time of day (e.g. 09:00) or elapsed time (e.g. minutes). The vertical y-axis represents distance from a starting point (often "home").
Stationary periods and speeds
- Horizontal sections: A horizontal line means the distance from home is not changing as time passes. The traveller is stationary (stopped).
- Steeper lines represent greater speed: A slanted, straight line means the traveller is moving at a constant speed. The steeper the line, the greater the speed.
- Direction: A line sloping upwards means moving away from the start. A downward line means moving back towards the starting point, not negative speed.
- Vertical sections: A vertical section is impossible, because a traveller cannot move a distance in zero time.
Calculating speed
Speed is calculated using the formula: Speed = change in distance ÷ change in time.
To find the speed in km/h, the change in distance must be in kilometres, and the change in time must be in hours. If the time on the graph is in minutes, minutes must be converted to hours (e.g., 30 minutes = 0.5 hours, or 15 minutes = 0.25 hours) for km/h calculations.
Distance and average speed
- Total distance travelled: Total distance travelled is found by adding the absolute distance changes across every section. Do not just look at the highest point on the graph.
- Whole-journey average speed: Whole-journey average speed uses total distance and total elapsed time, including stops. You cannot just average the speeds of the separate moving sections.
Constructing a distance-time graph
To construct a graph from a written journey, calculate the time and distance for each chronological turning point. Plot each turning point on the graph in order, then join them with straight segments.
Worked example
A cyclist leaves home at 10:00 and travels 20 km away. She arrives at 10:30, stays for 45 minutes, and then travels back home, arriving at 12:15.
- Outward journey: The line goes from (10:00, 0 km) up to (10:30, 20 km). She travelled 20 km in 30 minutes (0.5 hours). Her outward speed = 20 ÷ 0.5 = 40 km/h.
- Stationary period: The line is horizontal from (10:30, 20 km) to (11:15, 20 km). She stopped for 45 minutes.
- Return journey: The line goes downwards from (11:15, 20 km) to (12:15, 0 km). She travelled 20 km back home in 1 hour (60 minutes). Her return speed = 20 ÷ 1 = 20 km/h.
- Total distance: 20 km out + 20 km back = 40 km.
- Whole-journey average speed: Total distance is 40 km. Total elapsed time is from 10:00 to 12:15, which is 2 hours 15 minutes, or 2.25 hours. Average speed = 40 ÷ 2.25 ≈ 17.7 km/h.
Common mistakes
- Confusing distance-time graphs with speed-time graphs.
- Reading a vertical-axis value as speed.
- Forgetting to convert minutes to hours when calculating speed in km/h.
- Using greatest distance from home as total distance.
- Averaging separate speeds.
- Omitting stopped time from whole-journey average speed.
- Drawing vertical journey sections.