
Plotting cubic graphs
This worksheet provides interactive practice for completing tables of values and plotting cubic graphs accurately. It covers identifying cubic shapes, working with positive and negative leading coefficients, and recognising that cubics may have zero or two turning points. Jump to the questions
Practise now
Worksheet preview and key skills
In this worksheet, you will practise:
- Recognising the shape of cubic graphs.
- Completing tables of values for cubic functions.
- Plotting coordinates accurately on a grid.
- Understanding the effect of positive and negative leading coefficients.
- Drawing smooth cubic curves through plotted points.
If you are unsure how to start, read the Topic guide.
Plotting cubic graphs
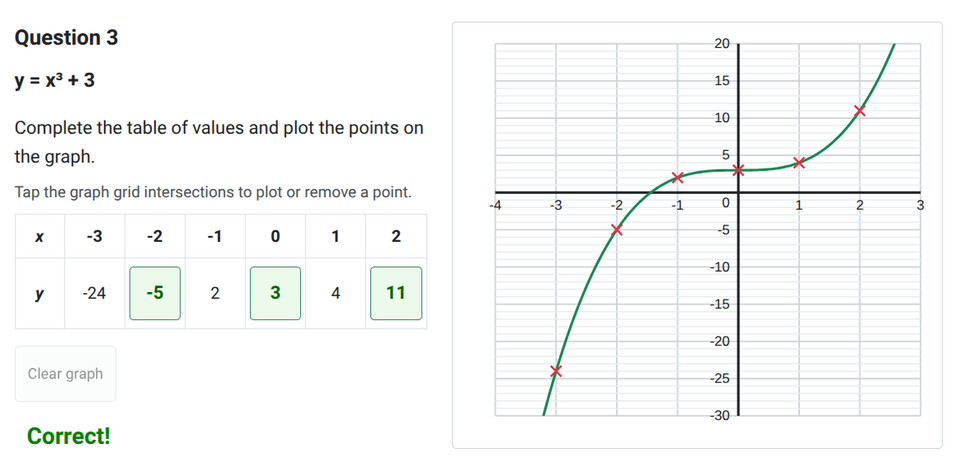
Complete the table of values and plot the points. When your points are correct, the smooth curve will be shown.
Topic guide
A cubic graph is produced by a function where the highest power of $x$ is $3$, for example $y = x^3 - 3x + 2$.
The shape of a cubic graph
The simplest cubic graph is $y = x^3$. As $x$ gets larger, $y$ gets larger very quickly. As $x$ gets more negative, $y$ gets more negative very quickly. This produces a smooth curve that generally runs from the bottom-left to the top-right.
More complex cubics may have zero or two turning points, but they always have a point of inflection (where the curve changes from bending one way to bending the other). A cubic with a negative leading coefficient, such as $y = -x^3$, will run from the top-left to the bottom-right.
Worked example: Plotting a cubic graph
Question: Complete the table of values for $y = x^3 - 3x + 2$ and plot the graph for values of $x$ from $-3$ to $3$.
Step 1: Calculate the missing values
Substitute each $x$-value into the equation carefully.
- When $x = -3$: $y = (-3)^3 - 3(-3) + 2 = -27 + 9 + 2 = -16$
- When $x = -2$: $y = (-2)^3 - 3(-2) + 2 = -8 + 6 + 2 = 0$
- When $x = 0$: $y = (0)^3 - 3(0) + 2 = 0 - 0 + 2 = 2$
- When $x = 2$: $y = (2)^3 - 3(2) + 2 = 8 - 6 + 2 = 4$
Step 2: Plot the coordinates
Plot the pairs $(-3, -16)$, $(-2, 0)$, $(-1, 4)$, $(0, 2)$, $(1, 0)$, $(2, 4)$, and $(3, 20)$ on the coordinate grid.
Step 3: Draw a smooth curve
Join the plotted points with a single, smooth continuous curve. Do not use a ruler to join them with straight lines.
Common mistakes
- Sign errors with negative numbers: Remember that $(-2)^3$ is $-8$, not $8$. Odd powers preserve the negative sign. Also, subtracting a negative number is equivalent to adding a positive number.
- Drawing straight lines: A cubic graph is a curve. Do not join the plotted points with straight line segments using a ruler.
- Sharp turning points: Any turning points on a cubic curve should be rounded and smooth, not sharp corners.
- Misplotted points: If one point breaks the smooth pattern of the curve, double-check your substitution for that $x$-value.