
Reciprocal graphs
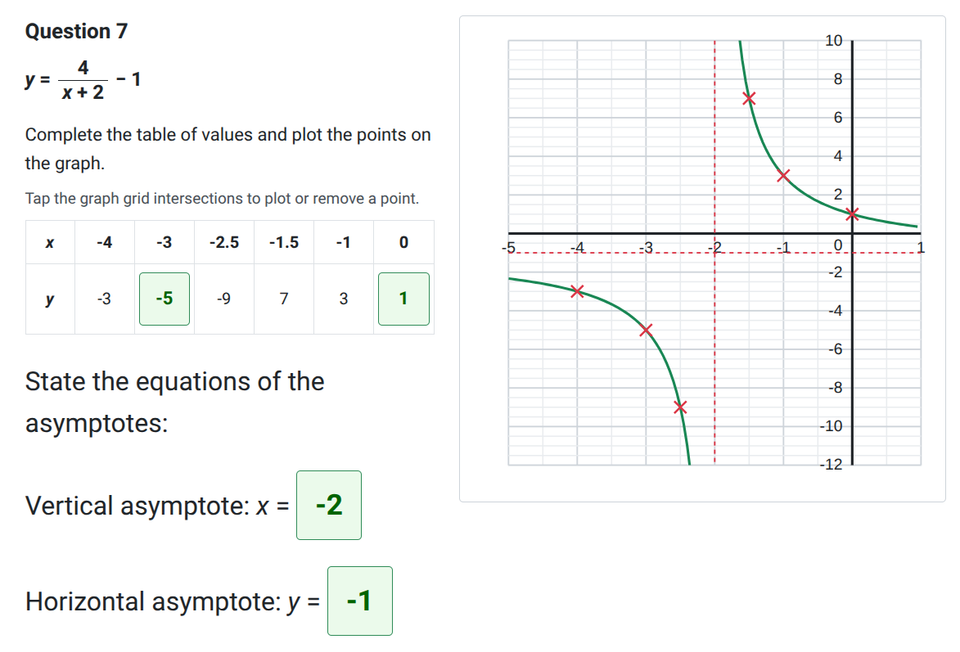
This worksheet provides interactive practice for completing tables of values and plotting reciprocal graphs accurately. It covers identifying reciprocal shapes, working with positive and negative graphs, and identifying horizontal and vertical asymptotes. Jump to the questions
Practise now
Worksheet preview and key skills
This interactive worksheet allows students to practice drawing reciprocal graphs dynamically on screen.
- Recognising the shape of positive and negative reciprocal graphs
- Substituting values to complete a table of coordinates
- Understanding that $x=0$ is undefined for a standard reciprocal
- Plotting both branches of a reciprocal curve accurately
- Identifying the vertical and horizontal asymptotes of translated reciprocal graphs
- Finding and correcting plotting errors in graphs with asymptotes
If students need a reminder of how to evaluate reciprocals or identify asymptotes, they can read the Topic guide.
Reciprocal graphs
Practise recognising, plotting and interpreting reciprocal graphs.
Topic guide
A reciprocal graph is produced by dividing by a variable, such as $y = \frac{1}{x}$.
The shape of a reciprocal graph
The simplest reciprocal graph is $y = \frac{1}{x}$. You cannot divide by zero, so the function is undefined when $x = 0$. This splits the graph into two separate curves, called branches.
- For positive values (e.g. $y = \frac{1}{x}$ or $y = \frac{4}{x}$), the branches appear in the top-right and bottom-left quadrants.
- For negative values (e.g. $y = -\frac{1}{x}$), the branches appear in the top-left and bottom-right quadrants.
Asymptotes
An asymptote is a line that the graph gets closer and closer to, but never touches. For $y = \frac{1}{x}$, the axes themselves ($x = 0$ and $y = 0$) are the asymptotes.
Never join the two branches across the vertical asymptote. They must remain separate.
Worked example: Plotting a reciprocal graph
Question: Complete the table of values for $y = \frac{2}{x}$ and plot the graph.
Step 1: Calculate the missing values
Substitute the $x$-values into the equation. For example, using $-2, -1, -0.5, 0.5, 1, 2$:
- When $x = -2$: $y = \frac{2}{-2} = -1$
- When $x = 0.5$: $y = \frac{2}{0.5} = 4$
Step 2: Plot the coordinates
Plot the points accurately. Because $x=0$ is not included, you will see two separate groups of points.
Step 3: Draw the smooth curves
Join the points in the bottom-left with one smooth curve, and the points in the top-right with another smooth curve.
Translated reciprocal graphs
When the equation changes form, the asymptotes move with it.
For example, in $y = \frac{2}{x-1} + 2$:
- The denominator cannot be zero, so $x - 1 \neq 0$. Therefore, the vertical asymptote is $x = 1$.
- As $x$ gets very large, the fraction gets close to zero, leaving just $+ 2$. Therefore, the horizontal asymptote is $y = 2$.
Common mistakes
- Joining the branches: Do not draw a single continuous line that crosses the vertical asymptote.
- Straight lines: Use a smooth curve, not straight lines drawn with a ruler.
- Dividing incorrectly: Remember that dividing by a fraction like $0.5$ makes the answer larger (e.g. $2 \div 0.5 = 4$).