
Plotting quadratic graphs
Practise completing tables of values and plotting the coordinates to draw smooth quadratic graphs. You'll work with equations like $y = x^2$ and $y = x^2 - 2x + 3$, learning to substitute negative values carefully and identify when a point has been plotted incorrectly. Jump to the questions
Practise now
Worksheet preview and key skills
Worksheet preview
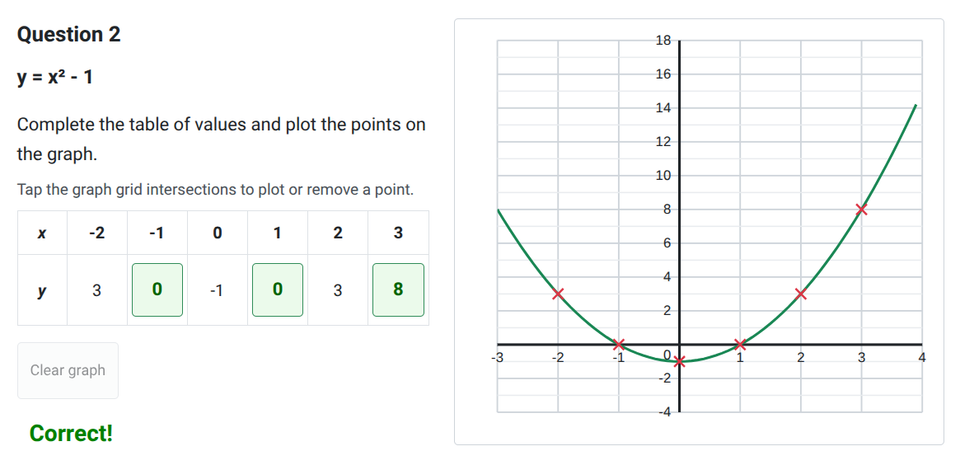
This worksheet provides interactive practice for plotting quadratic graphs. You will complete missing values in a table, plot the points on a grid, and see the smooth parabola appear when your coordinates are correct.
The questions progress from simple $y=x^2$ graphs to full quadratics, including downward-opening curves and exercises where you must spot and correct deliberate plotting errors.
What you’ll practise
- Substituting positive and negative $x$-values into a quadratic equation.
- Completing a table of values accurately.
- Plotting coordinate pairs on a Cartesian grid.
- Recognising the characteristic smooth parabolic shape, opening upwards or downwards.
- Identifying and correcting common misplotted points.
Use the interactive worksheet below, or read the Topic guide for the method and worked example.
Plotting quadratic graphs
Complete the table of values and plot the points. When your points are correct, the smooth curve will be shown.
Topic guide
A quadratic graph represents an equation where the highest power of $x$ is 2, such as $y = x^2$ or $y = 2x^2 - 3x + 1$. When plotted, a quadratic graph forms a smooth, symmetrical curve called a parabola. It will look like a 'U' shape (if the $x^2$ term is positive) or an 'n' shape (if the $x^2$ term is negative).
How to plot a quadratic graph
- Complete the table of values: Substitute each $x$-value from the table into the equation to find the corresponding $y$-value.
- Write the coordinates: Pair each $x$-value with its $y$-value to form coordinate pairs $(x, y)$.
- Plot the points: Mark each coordinate pair on the grid.
- Draw the curve: Join the points with a single, smooth, flowing curve. Do not use a ruler to connect the points with straight lines.
Worked example
Complete the table of values and plot the graph of $y = x^2 - 2x - 3$ for values of $x$ from $-2$ to $4$.
First, substitute the $x$-values into the equation. Be very careful when substituting negative numbers: squaring a negative number gives a positive result.
- When $x = -2$: $y = (-2)^2 - 2(-2) - 3 = 4 + 4 - 3 = 5$
- When $x = -1$: $y = (-1)^2 - 2(-1) - 3 = 1 + 2 - 3 = 0$
- When $x = 0$: $y = (0)^2 - 2(0) - 3 = 0 - 0 - 3 = -3$
- When $x = 1$: $y = (1)^2 - 2(1) - 3 = 1 - 2 - 3 = -4$
- When $x = 2$: $y = (2)^2 - 2(2) - 3 = 4 - 4 - 3 = -3$
- When $x = 3$: $y = (3)^2 - 2(3) - 3 = 9 - 6 - 3 = 0$
- When $x = 4$: $y = (4)^2 - 2(4) - 3 = 16 - 8 - 3 = 5$
The completed table gives us the coordinates: $(-2, 5)$, $(-1, 0)$, $(0, -3)$, $(1, -4)$, $(2, -3)$, $(3, 0)$ and $(4, 5)$.
Plotting these points and joining them with a smooth curve reveals a symmetrical U-shaped parabola with its lowest point (vertex) at $(1, -4)$.
Common mistakes to avoid
- Sign errors with negative numbers: Remember that $(-3)^2$ is $9$, not $-9$. Also, subtracting a negative number is equivalent to adding a positive number.
- Drawing straight lines: A quadratic graph is a curve. Do not join the plotted points with straight line segments using a ruler.
- A pointed vertex: The bottom (or top) of the curve should be rounded and smooth, not a sharp point.
- Misplotted points: Because quadratic graphs are symmetrical, a single misplotted point will usually stand out because it disrupts the smooth parabolic shape. If one point breaks the pattern, double-check your substitution for that $x$-value.