
Solving linear simultaneous equations graphically
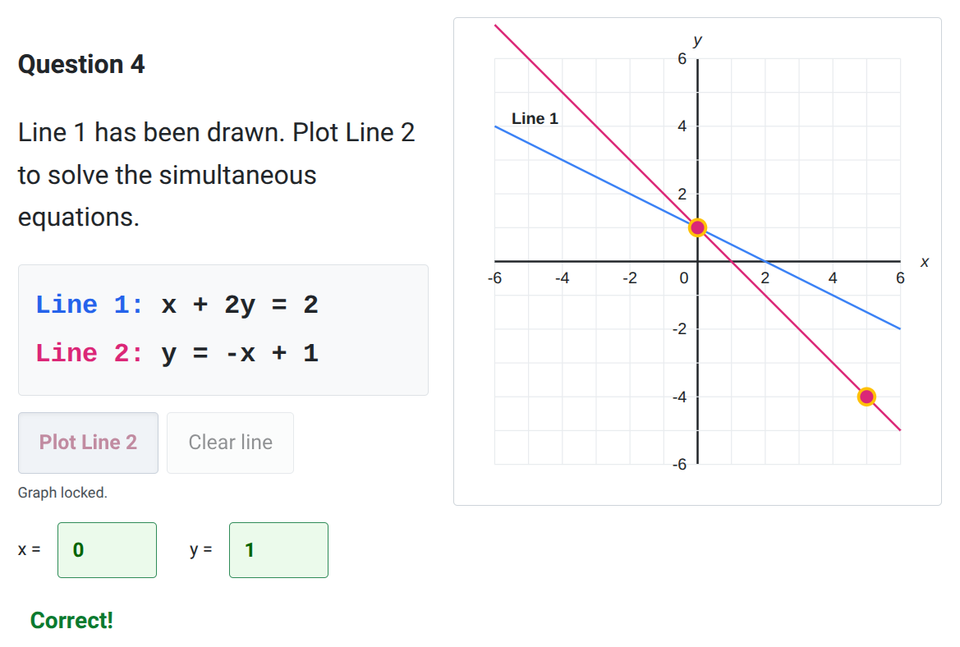
Simultaneous equations can be solved by drawing the straight-line graph for each equation.
Because the coordinates of every point on a line are solutions to its equation, the point where two lines intersect gives the one pair of coordinates that solves both equations at the same time. The x-coordinate of the intersection is the x solution, and the y-coordinate is the y solution. Jump to the questions
Practise now
Worksheet preview and key skills
Worksheet preview
This worksheet practises solving pairs of simultaneous linear equations by drawing and interpreting their straight-line graphs.
You will start by reading coordinates from lines that have already been plotted, before moving on to drawing your own straight-line graphs to find the intersection.
What you’ll practise
- reading the exact intersection of two straight-line graphs;
- plotting a missing line accurately to find a solution;
- rearranging equations into a form that can be graphed;
- drawing two lines from scratch and using their intersection to solve the equations;
- interpreting what a graphical solution means and why lines that don't cross on a small grid might still have a solution.
Use the interactive worksheet below, or read the Topic guide for the method and worked example.
Solving linear simultaneous equations graphically
Find the solution to each pair of simultaneous equations by finding the intersection of their straight-line graphs.
Topic guide
Solving simultaneous equations means finding a pair of values (an x value and a y value) that makes both equations true at the same time.
Every straight-line graph represents all the possible pairs of (x, y) coordinates that satisfy its equation. If we draw the graphs for two equations on the same set of axes, the point where the two lines intersect lies on both lines. This means the coordinates of the intersection point satisfy both equations simultaneously.
How to solve simultaneous equations graphically
To find the solution to a pair of linear simultaneous equations:
- Draw the first line: Plot at least two points that satisfy the first equation, then draw a straight line through them, extending it across the grid. If the equation isn't easy to plot immediately, it can help to rearrange it into the form
y = mx + cfirst. - Draw the second line: Repeat the process for the second equation on the same set of axes.
- Find the intersection: Look for the exact point where the two lines cross.
- Read the coordinates: The x-coordinate of the intersection is your x solution, and the y-coordinate is your y solution.
Always check your answer by substituting the x and y values back into both original equations to make sure they work.
Worked example
Solve the simultaneous equations:
y = 2x - 3y = -x + 3
Step 1: Plot the lines
For the first line, y = 2x - 3, the y-intercept is -3 and the gradient is 2. We can plot the points (0, -3) and (2, 1) and draw a line through them.
For the second line, y = -x + 3, the y-intercept is 3 and the gradient is -1. We can plot the points (0, 3) and (3, 0) and draw a line through them.
Step 2: Find the intersection
The two lines cross at the coordinate (2, 1).
Step 3: State the solution
The solution is therefore:
x = 2y = 1
What if the lines don't cross?
Straight lines continue infinitely. Sometimes, you might draw two line segments on a graph that do not cross within the visible grid.
If the two lines have different gradients (slopes), they are not parallel. This means they will eventually meet if you extend them far enough, or if you look at a larger portion of the coordinate plane. The fact that they don't cross on the small grid in front of you does not mean there is no solution!
If two lines have exactly the same gradient but different y-intercepts, they are parallel and will never cross. In that specific case, there is no solution to the simultaneous equations.